
The impact on Earth of solar activity have been observed roughly since World War II, when the Sun was recognised as an important source of radio noise affecting military radars, and when it appeared that radio-communications were sometimes highly perturbed as a consequence of big solar flares. Today, the scientific, technical, human and economical impacts of the Solar-Terrestrial relations are widely recognised (Koshinen et al, 1999). The sunspot number is the oldest solar index measuring the solar activity and its main interest results from its long-term behaviour and the length of its series. For a long time, it was the only index representative of the solar cycle, and many studies on the cyclical behaviour of the Sun were led using the Sunspot Number. That is the reason why the international scientific community, through the International Council of Scientific Unions (ICSU), has renewed many times the expression of its high interest in this index and committed its computation to a specific service like the SIDC.
The SIDC was founded in 1981 to continue the work of the Zurich Observatory, when this institution decided to stop publishing the sunspot number. An agreement was therefore taken between the ETHZ at Zurich (represented by O. Stenflo), the Specola Solare Ticinese at Locarno (represented by S. Cortesi) and the SIDC (represented by A. Koeckelenbergh). Following this agreement, the Sunspot Index Data center, started in January 1981 with the production of a sunspot index, called International Sunspot Number. The continuity and coherence with the former index of Zurich was assured through the use of Locarno (one of the three main stations of the Zurich network) as reference station. The SIDC now also provides daily activity reports and forecasts of the status of the space environment. This 'space weather' activity is part of the International Space Environment Services (ISES) that co-ordinates 10 regional warning centers (RWC). These 10 warning centers exchange mutually the latest space weather related data and make it available to a wide public. The SIDC is part of the Department of Solar Physics of the Royal Observatory of Belgium (ROB) and has available the complete archive of the EIT (Extreme UV Imaging Telescope on board SOHO) observations, and the know-how acquired by the local team of co-investigators in the EIT experiment. The archive covers now the whole rising part of cycle 23, and allows long-term analysis of the data.
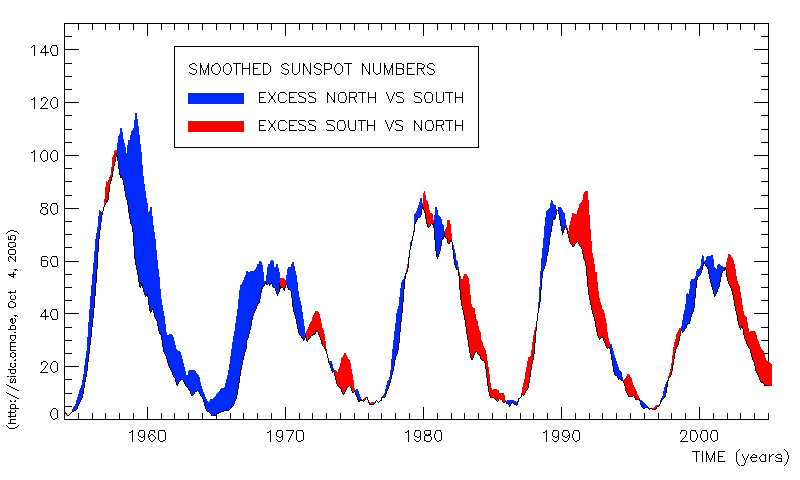
Figure 1:
The Sunspot number as a function of time, showing the well-known
11-year cycle and the hemispheric differences.
For a zoom-in on the present cycle: see Fig. 2.
The wide range of time scales, over which the Sun is evolving, is reflected by the large number of warnings, reports and data products that are issued at the SIDC. Table 1 shows the different products provided by the SIDC.
Table: Overview of the different messages distributed by the SIDC. Outgoing messages can be either in plain text format or encoded in the ISES message codes (http://www.sec.noaa.gov/ises/ises_code_pages/index_page.html). Regular contributions are also made in the Quarterly Bulletin on Solar Activity (QBSA, Mitaka, Japan) and to Solar Geophysical Data (SGD, NOAA, USA).
The products are freely available to both the scientific community as well as to the wide public, at the anonymous ftp site ftp://omaftp.oma.be (directory dist/astro/sidcdata), and at the Web address: http://sidc.oma.be . This web site receives on average 840 visitors per week. We estimate that 8 % of our visitors come from within Belgium, 50% within Western Europe and 40% from North America. The web site also contains a long list of 'Solar Influences links' to institutes worldwide, as well as an overview of the latest SOHO movies and images. The information on the web site and on the ftp server is updated as soon as new data become available. After a registration procedure on the http://sidc.oma.be web site, new users can also receive all these messages via email, as soon as they are produced. The monthly Sunspot bulletin has a circulation of around 470 copies.
Calculation of the International Sunspot Number
The sunspot number is the oldest solar activity index. In 1849, R. Wolf of the Zurich Observatory proposed the now widely used formula: R= K (10 G + S) in which S represents the number of observed sunspots and G the number of observed sunspot groups. The quality factor K was introduced later on to compare results from different observers, sites and telescopes. The task of the SIDC consists in collecting the observations from as many stations as possible worldwide, to determine the appropriate k factor for each of them and to extract an overall 'international sunspot number' from all these observations in a good statistical sense. As some observing stations have faster communication possibilities (e-mail) than others (regular mail), this task is split in two stages: first a provisional value is calculated and later on, when all observations have been received, a definitive value is adopted.
The Provisional International Sunspot Number
The coefficient of the reference station LOCARNO, with respect to the International Sunspot Number is fixed at the value of K=0.6, which was the value already used when Zurich was in charge of the sunspot number. The daily Ri 's are monthly calculated in the following way:
- For every station, the daily reduction coefficients to LOCARNO are calculated and monthly averaged. The rms standard deviations are calculated and a first elimination of data is worked out using a 2-sigma criterion. The monthly average of the reduction coefficient is then re-calculated. Using these coefficients, a first series of daily sunspot numbers is computed, together with their standard deviation. New monthly means and monthly standard deviations of the reduction factors are then computed, after elimination of the daily factors exceeding the standard deviation.
- Elimination on the basis of a 1-sigma criterion is again used on newly calculated daily means, until the number of retained stations remains unchanged, or the final relative standard deviation is lower than 10%. The final result is retained as the daily International Provisional Sunspot Number Ri, except when it is nearly zero. In this case, a special procedure is used, taking into account that when a significant fraction of the stations has non-zero values, it is accepted that Ri does not vanish, and only those stations that have observed sunspots are retained in its computation.
The number of stations collaborating to the program of the provisional sunspot numbers is typically around 40. The geographic distribution of the observers is: 10% from Belgium, 60% from other European countries, and 30% from the rest of the world. Our collaborators are for 35% professional astronomers, the rest being amateurs and other various contributors, such as military stations and meteorological stations.
The same method as for the provisional data is used, but with the 70 stations available for the calculation of the definitive sunspot number. The provisional and definitive sunspot numbers are then compared on a daily basis. When they do not differ from each other by more than 5%, the provisional value is accepted as definitive. Otherwise, the definitive value is generally adopted, except if the daily histogram of the sunspot numbers shows an anomalous distribution, in which case a new value is calculated after elimination of too discordant stations.
The quality of the output Ri data is regularly checked
by comparisons between the sunspot
number Ri on one hand and an average of about 20 selected good stations
(including the Locarno reference station) or the 10.7 cm radio flux on the
other hand. The purpose of these comparisons is to:
(1) detect possible long term discrepancies (e.g. systematic drifts) in Ri,
(2) select additional reference stations, to minimise such effects in the future
and ensure a good continuity in the computation of Ri.
Applied to the beginning of cycle 22, this control has detected systematic
differences at the preceding minimum, and in the first part of the rising
phase. We concluded there was a slight overestimate of the International
Sunspot Number during this period (Cugnon, 1997). Comparisons are also made
occasionally with the Sunspot Number calculated by the American Association of
Variable Stars Observers (AAVSO).
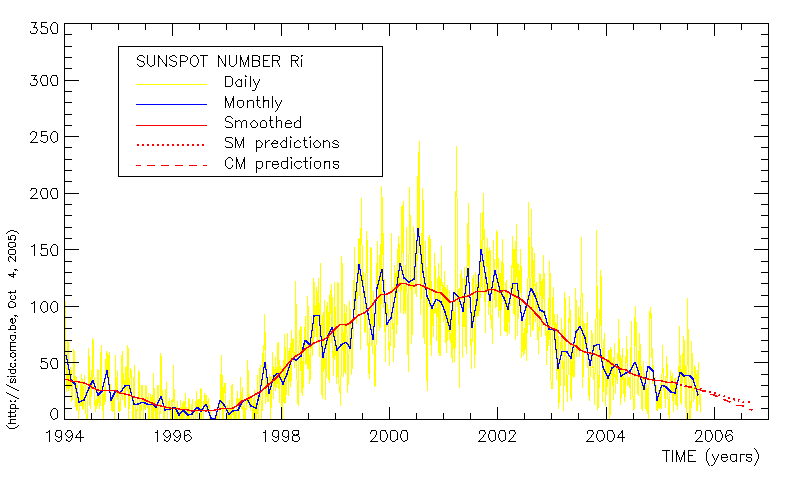
Figure 2:
Daily, monthly, monthly smoothed International Sunspot number and
predictions as a function of time.
Other Sunspot Numbers related products
The hemispheric sunspot numbers Rn (north) and Rs (south) are provided since August 1992. They are calculated in the same way as the total sunspot numbers, but separately for both hemispheres. The number of contributing stations is around 30 for the provisional values and 50 for the definitive ones. The results are normalised to the International Sunspot Number, in order to satisfy the relation Rn + Rs = Ri.
The study of the behaviour of the hemispheric sunspot numbers (Fig. 3) has confirmed (P. Lantos, P. Cugnon and A. Koeckelenbergh, 1993) the periodicity around 75 years observed by Waldmeier (1968) in the North-South asymmetry. On the other hand, a modulation of 80 years of the sunspot cycle has been proposed by Gleissberg (1967). We studied this last periodicity, using a running Fourier analysis (discrete FT on 240 years, with apodisation). An evolution in time of Gleissberg's cycle period from around 85 to 100 years was found. The rough concordance in time between Waldmeier's and Gleissberg's periods may suggest a common interpretation invoking the same origin, i.e. the N-S asymmetry. Further investigations on this are needed.
Waldmeier (1968) carried out a careful examination of the cycles (up to cycle 18) and subsequently defined classes of cycles that he used to build a set of standard curves. By shifting these curves to align their respective maxima, he remarked that all the curves were crossing each other in a very small region near R=50, so that the time interval between the crossing "point" and the maximum is roughly constant (1.9 year). From this property Waldmeier derived a method for predicting the position and amplitude of the maximum (see also Lantos, Cugnon and Koeckelenbergh, 1993). Since 1981, the SIDC proposes 12-month predictions based on Waldmeier's standard curves. A detailed analysis of various forecasting techniques due to K. Denkmayr (1993) showed that purely statistical methods tend to be inaccurate in the rising phase of the solar cycle. He proposed a precursor method that employs the geomagnetic aa index as a proxy indicator of the "new" magnetic field that builds up in the polar regions of the Sun when the old cycle is declining. This forecasting method, described in Denkmayr and Cugnon (1997), has been implemented in the SIDC software and provides an alternative set of predictions since 1997 (Fig. 2).
Both forecasting methods, like many others, use the time of occurrence of the smoothed sunspot number minimum as input. However, the position of the "true" minimum of activity is subject to controversy, due to different considerations, e.g. the separation between the "old" and the "new " cycles. A "corrected" latest minimum is used for instance by the SEC (NOAA, USA) for its predictions. We have considered the possibility of using a time of minimum calculated from a cubic regression on the monthly sunspot number, instead of the usual definition. Such a new definition seems to give a more accurate starting point for the predictions in many cycles: for instance, for cycle 23, the minimum occurs in August 1996 instead of May.
Since January, 1, 2000 the SIDC issues space weather forecasts in the context of the ISES network. The International Space Environment Service (ISES, http://www.sec.noaa.gov/ises/ises.html) is a joint service of URSI, IAU and IUGG and a permanent service of the Federation of Astronomical and Geophysical Data Services (FAGS, http://www.kms.dk/FAGS). Via the ISES network of Regional Warning centers (RWCs), data and forecasts of the space weather are mutually exchanged. From 1965 onwards, the Observatory of Meudon (Paris) acted as the RWC for Western Europe. In January 2000, when the Observatory of Meudon was unable to continue this service, the RWC activities were transferred to the SIDC. During Space Weather week (May 2000) in Boulder (US), the ISES assembled and granted the SIDC the official status of RWC for Western Europe.
Together with the transition of the RWC activities from Meudon to Brussels, the SIDC also inherited the procedures and software developed at Meudon for the daily space weather forecasts. Currently a major effort is spent on debugging/upgrading this software, merging it with the previous Sunspot index procedures and extending it with our EIT/LASCO know-how and software. A forecast room has been installed at the offices of the SIDC consisting of an array of screens displaying continuously, in near real-time the latest incoming satellite and ground based data.
| Observed zone | Data source | Key parameter |
| Photosphere | Catania, Ondrejov, | Sunspot groups/evolution |
| Ebre, Uccle, Meudon, etc. | ||
| - | SOHO/MDI magnetograms | Magnetic type of active regions |
| Chromosphere, | Catania, Meudon, | Active region location |
| transition region | SOHO/EIT 304 | |
| Corona | GOES X-ray channel | Flare occurrence |
| - | SOHO/EIT 195 CME watch | Active region evolution |
| - | Flare location | |
| - | CME/filament eruption | |
| - | SOHO/LASCO C2/C3 | (Halo) CME |
| Solar wind at L1 | ACE, SOHO/CELIAS | Wind speed, direction of IMF |
| SEP at earth orbit | GOES proton channel | Proton flux |
| Magnetosphere | Wingst, Chambon-la-Foret | Geomagnetic indices |
| Canberra, Hartland |
Table 3: Schematic overview of the main data flows from observations to data product.
Monitoring the status of the solar activity is done on the basis of encoded ISES messages from the other RWCs, from ground-based observatories in Western Europe and from satellite data available via the WWW. In Table 3, we show an overview of the main inputs used in the forecast. The experience of our team with the EIT and LASCO instruments turns out to be crucial. Both instruments are the best worldwide to detect respectively the onset and propagation through interplanetary space of coronal mass ejections (CMEs). In particular, image sequences from these two instruments yield very clear insight on the recent evolution of the solar activity.
Our daily forecast bulletin gives three-day predictions of the 10cm solar flux (an EUV proxy) and of the Ap index (planetary index of geomagnetic activity). Solar proton levels and solar flaring is predicted on a 2-days basis. Finally, a review of the activity of the preceding day is given.
The ongoing operational, daily forecasts depend largely on `empirical' rules-of-thumb. It is therefore important to have basic research to replace and/or support this untested human experience. The complete EIT archive covers now the whole rising part of cycle 23, and allows long-term analysis of the data. We have recently started a full scanning project of the archive, with the purpose of detecting and qualifying transient events and large scale structures in the corona. The return that is hoped for from this study is a significant progress in the forecasting methods of big disturbances. We have also embarked on a project involving numerical MHD simulations that take a wide range of observational data (ground observations, SOHO, ULYSSES, ACE and Cluster II) as input. The ROB is also co-investigator of the SECCHI package onboard the STEREO mission (launch 2004). The EUV imager, the Heliospheric imager and the coronagraph onboard each of the twin spacecrafts forming this mission are designed to follow solar wind structures from their solar origin up to the Earth's magnetosphere with a stereoscopic view. Therefore, STEREO will provide for the first time the possibility of monitoring in three dimensions the triggering and acceleration of CMEs, their journey through the solar wind and their arrival at the Earth's magnetosphere.
Space weather is a new and flourishing interdisciplinary science with direct relevance for technological systems. Solar activity varying from cycle to cycle might have an important impact on the climatic evolution on earth. Therefore, both on the short as well as on the long time scales, the study of 'Solar influences' is important for society as a whole. As a service center of the Royal Observatory of Belgium, the SIDC provides to the wide public a number of data products, forecasts and warnings that can help in identifying and anticipating these Solar Influences. For future growth and development of these services, it is essential to have a wide network of international collaborations. This is why the SIDC is altogether the World Data Center for the Sunspot Index belonging to the World Data Center network of the International Council of Scientific Unions (ICSU) , a Data Analysis service of the Federation of Astronomical and Geophysical Services (FAGS), a Regional Warning Center of the International Space Environment Service (ISES) and is closely linked with our involvement in the EIT and LASCO instruments onboard SOHO (ESA/NASA). In this context, we are ready to participate enthusiastically in any new initiative on Space Weather.