Based on the CACTus automated CME detection scheme, we have compiled an objective CME catalog spanning the period September 1997 - January 2007. We refer to it as the 'CACTus CME catalog' and it has been published online. The CACTus software package was first reported in Berghmans (2002) and is extensively described in Robbrecht & Berghmans (2004). A version of the CACTus software can be downloaded via SSW. The first steps of the construction of the automated CME catalog are described in Robbrecht et al. (2006).
This page provides details on the construction of the CME catalog, in particular:- Image selection
- Data availability and interruptions
- Organization of the catalog
- Reliability of the catalog
- Acknowledgement
Image selection
We have applied a stable version of the CACTus code (Robbrecht & Berghmans 2004) to the available data (level 0) from the LASCO C2 and C3 instruments. Prior to preprocessing, the images are tested for their usability. This step is performed in order to limit the amount of false detections due to corrupted images. They arise e.g. from dust particles or small debris passing in front of the telescope while an image was being exposed, from variations in exposure times, and from errors in data acquisition, transmission and reconstruction. To limit the computation time, the validity of the image is only tested by verifying certain meta data contained in the FITS file headers; a set of parameters has evolved through real-time application and rejects the majority of corrupted images, known to trigger a false CME detection. Only images satisfying the conditions summarized in Table 1 are accepted.
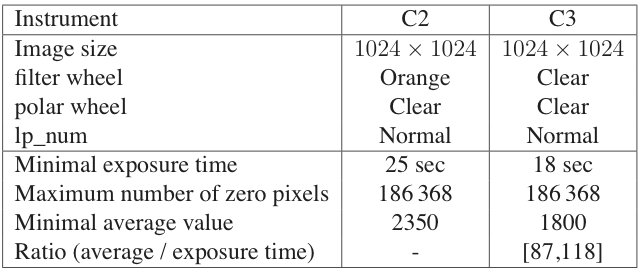
Table1: Table summarizing the header parameters required for image selection (top) and image quality verification (bottom). As can be deduced from the table, only unpolarized, full-size images are used for our CME detection.
This approach is not 100 % foolproof but only a small number of images for which nothing unusual is reflected in the image header pass the test. Three examples of such images are shown in Fig. 1. The LASCO coronagraphs are very sensitive to dust particles that pass through the field of view; such small particles, at small angles from the Sun, are illuminated by the bright Sun and are easily seen. The space environment is usually very clean, but sometimes a streak is observed in the images. Since the instrument is focused at infinity the particles appear out of focus, and thus broad. Hence they are not removed by the denoising technique in the preprocessing step.
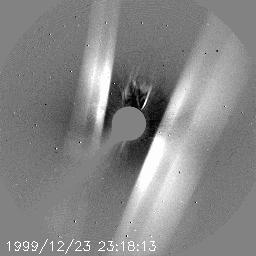
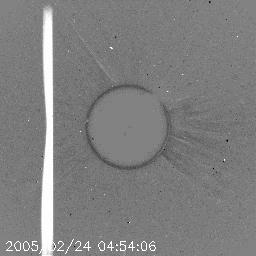
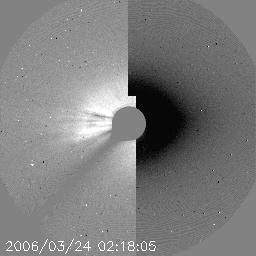
Figure 1: Three examples of bad LASCO images that passed the CACTus `sanity check' are shown. The two first images contain light scattered from dust particles or larger debris passing through the field of view. The image on the right is due to technical data acquisition problems. This is a common problem when working with real-time images.
Data availability and interruptions
During the first months of the mission, most LASCO images had their top and bottom cropped, for telemetry optimization. This style of image compression was gradually decreased and abandoned in September 1997. Moreover, the nominal cadence of both C2 and C3 was only 1 image per hour (compared to resp. 3 and 2 per hour in the extended phase of the mission). For these reasons the current data set used for our long-term analysis runs from September 1997 onwards.
Nominal observations have been interrupted as a consequence of exceptional satellite problems. A 3 month data gap occurred in 1998 from 24 June to 22 October due to an unexpected loss of contact with the spacecraft. Subsequent failure of all three gyroscopes caused an interruption from 21 December 1998 to 6 February 1999. A third crisis occurred in June 2003, when SOHO's main antenna motor failed. By locking the antenna, this problem was overcome and nominal observations resumed on July 10, but regular gaps of a few days through the rest of the mission duration occur during the subsequent SOHO data keyhole periods. We have created annual overview map as illustrated in Fig. 2 to give a guide to the data availability during that year.

Figure 2: Example of an overview map indicating the LASCO data used as CACTus input for 2003. Per month (January at the top, December at the bottom) a horizontal bar covering 31 days is drawn. For every C2/C3 image that was used as input a vertical white line is drawn.
Organization of the catalog
For practical reasons we have organized the detections per month. To avoid inaccurate detections of CMEs occurring near the beginning or end of a month, we have added to each month the last day of the previous month and the first day of the next. For example, a CME which first appears in C2 on the 31st of March at 22 UT is still visible in the C3 field of view on April 1. Without adding March 31st at the beginning of the April sequence, this CME would seem to appear on the 1st of April and thus it would be detected incorrectly.
|
The monthly output consists of a list of detected CMEs with their main parameters given and a so-called CME-map that gives an overview of the detections of this month. The header of every CACTus output file gives information on the first and last C2/C3 images used and gives a short description of every parameter listed. For each detection a speed profile is also available, indicating the detected speeds as a function of the position angle. An example is given in Fig. 3. The speed listed in the catalog is the median speed over the width of the CME. |

Figure 3: Example of a speed profile for a moderately wide and fast CME. |
:Issued: Thu Apr 26 20:15:06 2007 :Product: CACTUS catalogue of recent cmemap (http://sidc.oma.be/cactus) #---------------------------------------------------------------------- # Input: first and last data sources used in the current run # first c2: 2006/02/28 01:46:13.865 22219708.fts last c2: 2006/04/01 23:54:04.992 22223667.fts first c3: 2006/02/28 01:50:32.063 32155165.fts last c3: 2006/04/01 23:42:05.069 32156241.fts # #---------------------------------------------------------------------- # Output: Detected cmemap with the following parameters: # # cmenr: cme identification number # t0: onset time, earliest indication of liftoff # dt0: duration of liftoff (hours) # pa: principal angle, counterclockwise from North (degrees) # da: angular width (degrees), # v: median velocity (km/s) # dv: variation (1 sigma) of velocity over the width of the CME # mindv: lowest velocity detected within the CME # maxdv: highest velocity detected within the CME # halo?: "*" if angle > 90, indicating potential halo/partial halo CME # |
How to use the catalog
CACTus was designed to detect CMEs according to their observational definition as "a new, discrete, bright white-light feature in the coronagraphic field-of-view, moving radially outward". Utilizing this definition implies that we have not assumed any physical model while characterising and detecting CMEs. CACTus detects many more events than are listed in the classical, manually compiled catalogs. While browsing the catalog, you will find many small events that do not correspond to the current classical CME picture. They occur independently, prior to or in the aftermath of a large eruption. In the latter case they are not usually included in the classical catalogs, since they are considered part of the whole eruption. ARTEMIS, another automated CME detection scheme, also detects significantly more small events than generally listed by an observer.
The catalog has NOT been validated post-compilation, therefore it is inevitable that the list contains a number of false or wrong detections. We suggest that the user check every detection in the LASCO images; blind use of the catalog is not advised. False detections can be caused by corrupted images that passed the image-test of CACTus (only the header is tested) or exceptional exposure times. Additionally CACTus can produce an inaccurate detection as a consequence of splitting a CME into several parts, or merging events that are close in time or space.
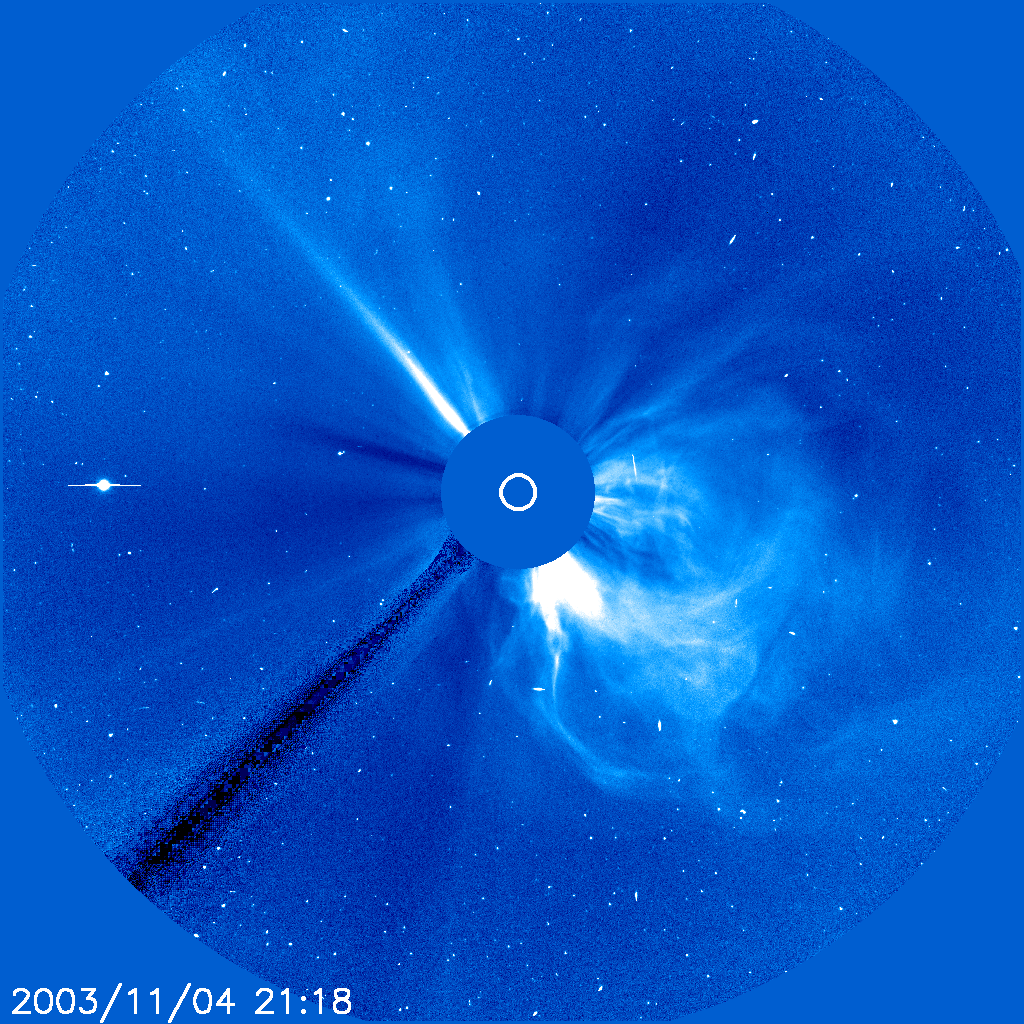
Figure 4: Example of a LASCO C3 image, the effect of the pylon holding the occultor is visible in the south east. |
The C2 and C3 coronagraphs are both externally occulted. This means a circular occulting disk is placed in front of the entrance aperture. Hence, no direct sunlight falls into the instrument, reducing the stray light significantly. But, as a consequence, the region around the pylon holding the occulter has both a lower signal and smaller signal to noise ratio (this effect is clearly visible in any LASCO C3 image, (see Fig.4). As a consequence the CACTus software detects more "noisy events" around this position (135 degrees from solar north, or 315 degrees when SOHO is inverted). The list contains a number of so-called "marginal events". The majority of these events are detections for which the signal was near the noise level. However, due to misclassification also some 'real events' have been placed in this category. |
Acknowledgement
If you use the CACTus CME catalog, we ask that you inform us; please send us a copy of the resulting research report or paper and please include the following acknowledgement: "This paper uses data from the CACTus CME catalog, generated and maintained by the SIDC at the Royal Observatory of Belgium." We recommend one of the publications listed here as reference for the CACTus method.