Sunspot index graphics
Click on figures for more detail
graphics are updated every first of the month
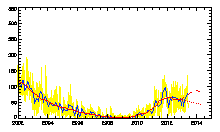
The daily, monthly and monthly smoothed sunspot numbers for the past 12 years, and predictions for 12 months ahead.
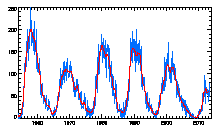
The monthly and monthly smoothed sunspot numbers are plotted for the present cycle and the latest five cycles.
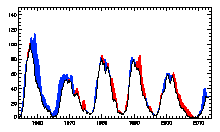
The north and south components of the monthly smoothed sunspot number for the present cycle and the latest five cycles.
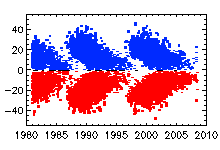
Maunder "butterfly" diagram.
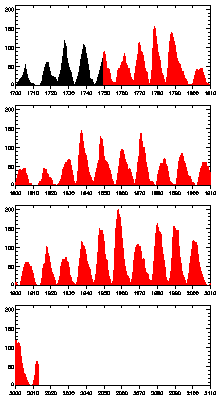
The sunspot number since 1750.