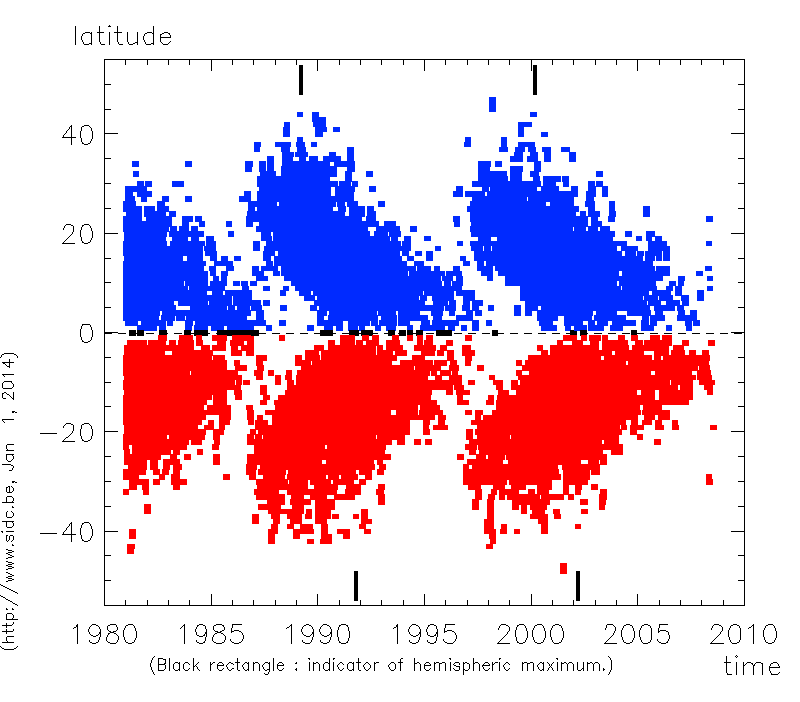
Maunder "butterfly" diagram for the past 30 years, showing the latitudinal distribution of sunspot groups during successive solar cycles. Group data from the Uccle station and Specola Solare Observatory, Locarno, Switzerland (Pilot station of the WDC sunspot network)